Bitcoin Price Watch: Can Bulls Push Past $110K or Will Bears Regroup?

Bitcoin is trading at $107,338 with a market valuation of $2.13 trillion, while its 24-hour volume reached $18.47 billion as the price fluctuated between an intraday range of $106,556 to $107,572. This consolidation signals a market pause, with technical indicators suggesting potential continuation if key resistance levels are surpassed.
Bitcoin
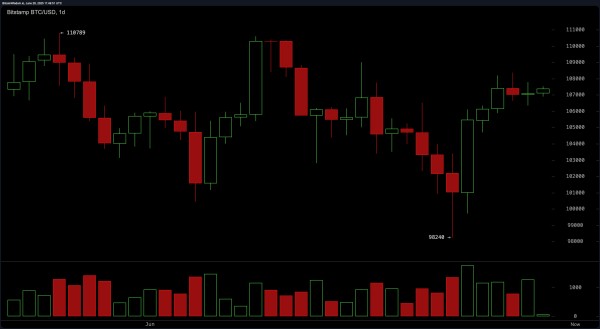
The daily chart highlights a resilient uptrend following bitcoin’s bounce from the $98,240 support level, which now acts as a pivotal demand zone. The presence of large bullish candles accompanied by rising volume reinforces the strength of the current rally. Immediate resistance stands at $108,500, followed by a stronger ceiling at $110,700, where traders may consider exiting long positions if momentum wanes. A favorable re-entry zone appears between $103,000 and $104,000, where traders should look for reversal confirmations before committing.

BTC/USD 1-day chart via Bitstamp on June 28, 2025.
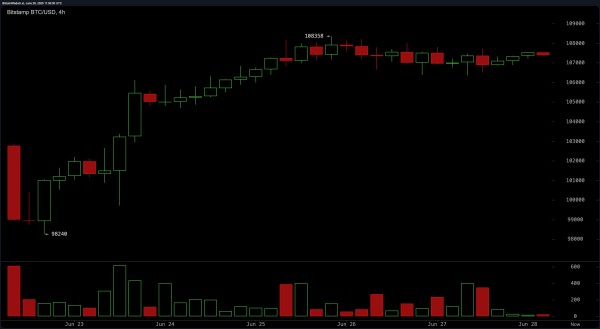
On the 4-hour chart, bitcoin maintains an upward trajectory but is currently navigating a sideways consolidation phase near recent highs. The price range between $106,000 and $108,500 is crucial, acting as both a short-term accumulation zone and a resistance band. A pullback to the $106,000–$106,500 area—aligned with key exponential moving averages (EMAs)—offers a favorable long entry, especially if supported by bullish patterns. Should the price break through $108,500 with volume, a continuation toward previous highs is plausible. Until then, traders may opt to reduce exposure if momentum diminishes and candles contract near resistance.

BTC/USD 4-hour chart via Bitstamp on June 28, 2025.
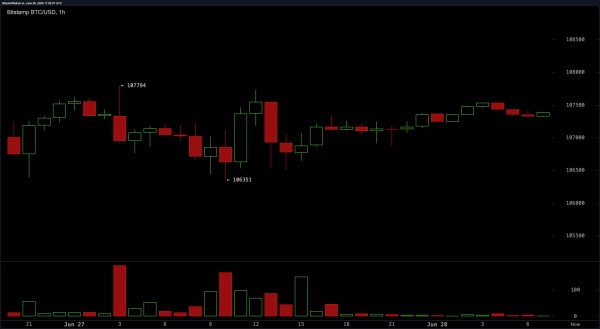
The 1-hour chart presents a compressed price action zone between $106,350 and $107,794, typical of low-volatility environments before breakout events. Volume has tapered off, indicating indecision, but this often precedes sharp movements. Traders may explore scalping opportunities near $106,500 if a bullish divergence emerges on the relative strength index (RSI). A clear break above $107,800, coupled with a volume spike, may confirm a short-term breakout setup. Conversely, rejection near the upper boundary with long wicks suggests caution and potential mean reversion. While consolidation seems like it’s been an eternity, something will happen soon enough.

BTC/USD 1-hour chart via Bitstamp on June 28, 2025.
Across major oscillators, the broader technical sentiment is neutral with a slight lean toward bullishness. The relative strength index (RSI), stochastic oscillator, commodity channel index (CCI), average directional index (ADX), and awesome oscillator each register neutral readings, offering no extremes in sentiment. Momentum stands out as the sole bearish indicator, issuing a negative signal, while the moving average convergence divergence (MACD) remains bullish. This divergence implies a market in equilibrium, awaiting a directional trigger.
The alignment of moving averages (MAs) across all key durations from 10 to 200 periods is unequivocally bullish. Every simple moving average (SMA) and exponential moving average (EMA) signals a buy, with current prices comfortably above all benchmarks. Notably, the 10-period EMA and SMA are positioned at $106,062 and $105,168, respectively, reinforcing immediate support. As the price hovers near highs, these technical supports provide a solid base for upward movement if bulls regain control. The interplay of price compression, volume behavior, and trend alignment suggests the market is preparing for its next decisive move.
Bull Verdict:
If bitcoin maintains support above $106,000 and breaks through the $108,500 resistance with rising volume, the market is poised for a bullish continuation toward the $110,700 level. Strong alignment across all moving averages, coupled with a stabilizing macro trend and low volatility conditions, supports the potential for renewed upward momentum.
Bear Verdict:
Should bitcoin fail to sustain the $106,000 support zone and momentum continues to deteriorate—especially with neutral-to-weak oscillator readings—price could retrace toward the $103,000–$104,000 range or lower. A lack of breakout volume and visible rejection near $107,800–$108,000 would signal buyer fatigue, opening the door for short-term downside pressure.

 Bitcoin
  Ethereum
  Tether
  XRP
XRP  USDC
USDC  Lido Staked Ether
  TRON
TRON  Dogecoin
  Cardano
  Wrapped stETH
  Figure Heloc
  Wrapped Bitcoin
  Chainlink
  Hyperliquid
  Bitcoin Cash
  USDS
USDS  Wrapped eETH
  Ethena USDe
  Binance Bridged USDT (BNB Smart Chain)
  Stellar
  LEO Token
  WETH
WETH  WhiteBIT Coin
  Sui
Sui  Coinbase Wrapped BTC
  Hedera
  Avalanche
  Zcash
Zcash  Litecoin
  Monero
  Shiba Inu
  Ethena Staked USDe
  Toncoin
  Dai
Dai  USDT0
USDT0  Cronos
  Polkadot
  Mantle
  Bittensor
  MemeCore
  sUSDS
sUSDS  Uniswap
  Aave
Aave  World Liberty Financial
  USD1
USD1  BlackRock USD Institutional Digital Liquidity Fund
  PayPal USD
  Bitget Token
  OKB
OKB  Internet Computer
  NEAR Protocol
  Pepe
Pepe  Ethena
  Ethereum Classic
  Jito Staked SOL
  Binance-Peg WETH
  Falcon USD
  Jupiter Perpetuals Liquidity Provider Token
  Tether Gold
  Wrapped SOL
  Aptos
Aptos  Ondo
Ondo  Pi Network
  Aster
Aster  USDtb
USDtb  POL (ex-MATIC)
  HTX DAO
  Worldcoin
  Dash
Dash  KuCoin
  Rocket Pool ETH
  Binance Staked SOL
  Arbitrum
  Official Trump
  Gate
Gate  Algorand
  Pump.fun
  syrupUSDT
  PAX Gold
  StakeWise Staked ETH
  BFUSD
BFUSD  Kinetiq Staked HYPE
  syrupUSDC
  Lombard Staked BTC
  Function FBTC
  Liquid Staked ETH
  Wrapped BNB
  VeChain
  Cosmos Hub
  Story
Story  Sky
Sky  Binance Bridged USDC (BNB Smart Chain)
  Jupiter
  Renzo Restaked ETH