XRP Price Watch: Bulls Defend $3 as Price Steadies at $3.04

On Sept. 12, 2025, XRP traded at $3.04, valuing the asset at a market capitalization of $181 billion. Over the last 24 hours, volume totaled $5.25 billion, with an intraday range of $2.99 to $3.07.
XRP
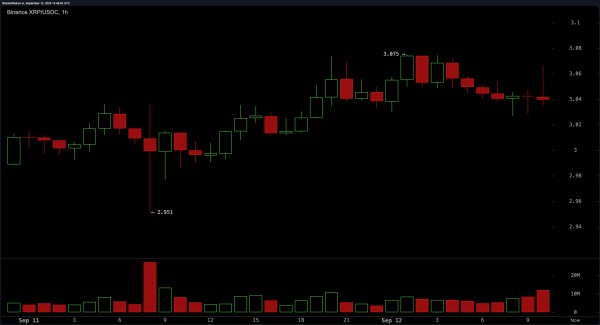
On the 1-hour chart, XRP is confined to a compact band between $3.02 and $3.075 following a mild pullback from the $3.075 local high, with price now stabilizing. The structure remains constructive, with higher lows intact even as a minor bearish divergence develops, inferred from price flattening. Tactical parameters around $3.02 to $3.04 stand for entries and $3.08 to $3.10 for near-term exits, consistent with a range-bound intraday bias.

XRP/USDC 1-hour chart on Sept. 12, 2025.
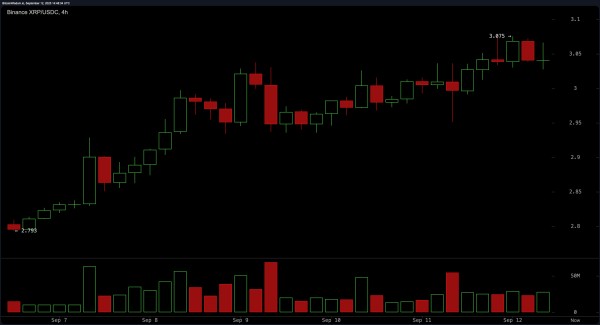
On the 4-hour view, XRP advanced from $2.793 to $3.075 and then rotated into a consolidation formation that resembles a bullish flag or an ascending triangle. Price is presently stabilizing above $3.00, and repeated lower wicks indicate that dips are being defended, while green-candle volume spikes suggest accumulation. The 4-hour window emphasizes confirmation above $3.08, a protective stop below $2.98, and a measured objective near $3.20 if momentum follows through.

XRP/USDC 4-hour chart on Sept. 12, 2025.
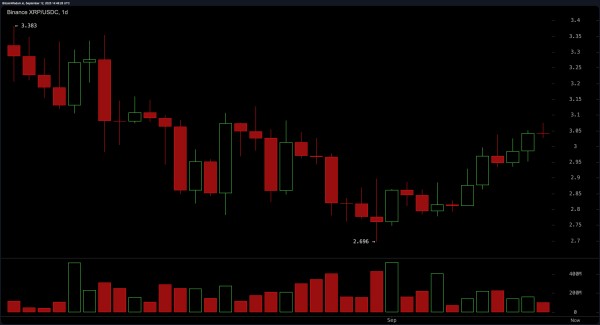
The daily setup details a prior downswing from $3.38 to $2.696 and a subsequent reversal with higher highs and higher lows, as XRP now tests resistance near $3.05. Key levels cite support at $2.70 to $2.80 and resistance at $3.10 to $3.15, with a daily close above $3.10 flagged as a continuation trigger. The daily view also notes a 24-hour gain of 2.16% versus the market’s 1.72% and records that XRP pushed above its 50-day exponential moving average at about $2.94 while the MACD histogram turned positive.

XRP/USDC daily chart on Sept. 12, 2025.
Oscillators are mixed but lean constructive in aggregate. The relative strength index (RSI) prints 56.34697, which is neutral; the Stochastic oscillator is 90.65678, also neutral. The commodity channel index (CCI) is 115.09691, and the average directional index (ADX) is 16.39368, both neutral. The Awesome oscillator (AO) is 0.00977 and reads bullish; momentum (MOM) is 0.17384 and reads bearish; the moving average convergence/divergence (MACD) level is −0.00123 but is characterized as bullish, with the MACD histogram specifically noted as positive at +0.026.
Moving averages (MAs) convey a broadly bullish posture across time frames. The exponential moving average (EMA) at 10, 20, and 30 days are $2.94710, $2.93591 and $2.94294, respectively, and the simple moving average (SMA) at 10, 20, and 30 days are $2.91187, $2.89922, and $2.93961; each is presented as bullish. Longer gauges reinforce the trend: EMA(50) $2.92397, SMA(50) $3.00999; EMA(100) $2.79721, SMA(100) $2.74459; EMA(200) $2.54981, SMA(200) $2.49861, all characterized as bullish. The latest data further shows that the price of XRP has cleared the 50-day EMA around $2.94, aligning with trend support.
Bull Verdict:
If XRP confirms above $3.08 and secures a daily close above $3.10, the current trend’s framework points to a measured objective near $3.20, aided by a positive moving average convergence/divergence (MACD) histogram and broadly bullish moving averages.
Bear Verdict:
If XRP fails to clear $3.10 and then loses $3.00/$2.98, the trend highlights $2.80 to $2.70 as the next key support zone, with oscillators mixed—Momentum negative and average directional index neutral—suggesting limited trend strength.

 Bitcoin
  Ethereum
  Tether
  XRP
XRP  USDC
USDC  Lido Staked Ether
  TRON
TRON  Dogecoin
  Cardano
  Wrapped stETH
  Figure Heloc
  Wrapped Bitcoin
  Chainlink
  Hyperliquid
  Bitcoin Cash
  USDS
USDS  Wrapped eETH
  Ethena USDe
  Binance Bridged USDT (BNB Smart Chain)
  Stellar
  LEO Token
  WETH
WETH  WhiteBIT Coin
  Sui
Sui  Coinbase Wrapped BTC
  Hedera
  Avalanche
  Litecoin
  Zcash
Zcash  Monero
  Shiba Inu
  Ethena Staked USDe
  Toncoin
  Dai
Dai  Cronos
  USDT0
USDT0  Polkadot
  Mantle
  Bittensor
  MemeCore
  sUSDS
sUSDS  Uniswap
  USD1
USD1  Aave
Aave  World Liberty Financial
  Internet Computer
  BlackRock USD Institutional Digital Liquidity Fund
  PayPal USD
  Bitget Token
  OKB
OKB  NEAR Protocol
  Pepe
Pepe  Ethena
  Jito Staked SOL
  Ethereum Classic
  Binance-Peg WETH
  Falcon USD
  Jupiter Perpetuals Liquidity Provider Token
  Solana
  Tether Gold
  Aptos
Aptos  Ondo
Ondo  Pi Network
  Aster
Aster  USDtb
USDtb  POL (ex-MATIC)
  HTX DAO
  Worldcoin
  Dash
Dash  KuCoin
  Rocket Pool ETH
  Binance Staked SOL
  Arbitrum
  Official Trump
  Gate
Gate  Algorand
  Pump.fun
  syrupUSDT
  PAX Gold
  StakeWise Staked ETH
  BFUSD
BFUSD  Kinetiq Staked HYPE
  syrupUSDC
  Lombard Staked BTC
  Liquid Staked ETH
  Function FBTC
  Wrapped BNB
  VeChain
  Cosmos Hub
  Story
Story  Sky
Sky  Binance Bridged USDC (BNB Smart Chain)
  Jupiter
  Renzo Restaked ETH
  NEXO
NEXO  Solv Protocol BTC
  Filecoin
  Ripple USD
  Global Dollar
  Render
  Sei
Sei  Pudgy Penguins
  Bonk
Bonk  Virtuals Protocol
  Mantle Staked Ether
  Arbitrum Bridged WBTC (Arbitrum One)
  Immutable
  Circle USYC
  clBTC
clBTC  Superstate Short Duration U.S. Government Securities Fund (USTB)
  OUSG
OUSG  Jupiter Staked SOL
  PancakeSwap
  Aerodrome Finance
  Ondo US Dollar Yield
  cgETH Hashkey Cloud
  Stables Labs USDX
  Optimism
  Celestia
  Decred
  Lido DAO
  Stacks
  Marinade Staked SOL
  Injective
  L2 Standard Bridged WETH (Base)
  tBTC
tBTC  Ether.Fi Liquid ETH
  Beldex
  The Graph
  Curve DAO
  Polygon Bridged USDC (Polygon PoS)
  Arbitrum Bridged WETH (Arbitrum One)
  USDai
USDai  FLOKI
FLOKI  Polygon PoS Bridged DAI (Polygon POS)
  SPX6900
  Tezos
Tezos  Usual USD
  Stader ETHx
  Artificial Superintelligence Alliance
  GTETH
GTETH  Pyth Network
  DoubleZero
  Kaia
Kaia  IOTA
IOTA  Mantle Bridged USDT (Mantle)
  TrueUSD
  Steakhouse USDC Morpho Vault
  Avalanche Bridged BTC (Avalanche)
  Plasma
  Coinbase Wrapped Staked ETH
  Cognify
  Trust Wallet
  Starknet
  Ether.fi
  Swell Ethereum
  AB
AB  sBTC
sBTC  Conflux
  Sonic
Sonic  Pendle
  The Sandbox
  Bitcoin SV
  BitTorrent
  ether.fi Staked ETH
  Humanity
  Ethereum Name Service
  Maple Finance
  GHO
GHO  ARK
ARK  Binance-Peg Dogecoin
  USDD
USDD  Helium
  Theta Network
  dogwifhat
  Sun Token
  GALA
GALA  JasmyCoin
  Satoshi Stablecoin
  Arbitrum Bridged Wrapped eETH (Arbitrum)
  Wrapped HYPE
  AINFT
AINFT  Decentraland
  ZKsync
  BENQI Liquid Staked AVAX
  Flow
Flow  Polygon PoS Bridged WETH (Polygon POS)
  Spiko EU T-Bills Money Market Fund