Top Research Firm Predicts XRP Run to $50, Here’s Why

XRP has continued to maintain support within an important multi-year channel months after Sistine Research predicted a massive rally.
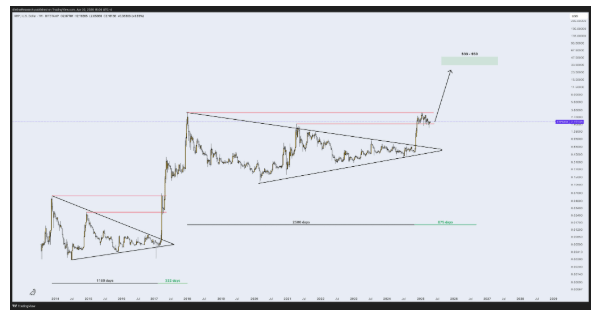
For context, Sistine Research first shared its long-term analysis in April, using a weekly chart to compare XRP’s current setup with its 2017 pattern. According to the analysis, XRP could rally to a peak of $50 if the right conditions align.
XRP Breaches Symmetrical Triangle
Data from the chart shows that after XRP dropped from the $0.06144 high in December 2013, it moved inside a tight symmetrical triangle that lasted 1,169 days between 2014 and 2017.
The Parallel Channel
However, the chart from Sistine Research identifies another parallel channel that took shape from April 2021. Notably, the upper red trendline of this channel emerged from the $3.31 peak in January 2018, representing the resistance of the channel. Meanwhile, the lower red trendline emerged from the $1.96 peak in April 2021, representing the support of the channel.
After XRP broke out of the symmetrical triangle, it entered this parallel channel, with support around $2 (the April 2021 peak) and resistance around $3.4 (the January 2018 peak). The Sistine Research chart indicates that it would need to breach the upper trendline to continue its uptrend.

XRP 1W Chart | Sistine Research
Importantly, this huge base mirrored the 2017 setup, only on a much larger scale. Measuring the triangle, the research firm set a conservative target between $33 and $50. It added that if the same structure is read as a cup and handle, the projection expands to $77–$100.
To frame the timeline, Sistine marked 675 days beyond the breakout zone for these targets to materialize. Specifically, this points to 2026 or early 2027 as the period when the targets could play out.
XRP Maintains Support at the Parallel Channel
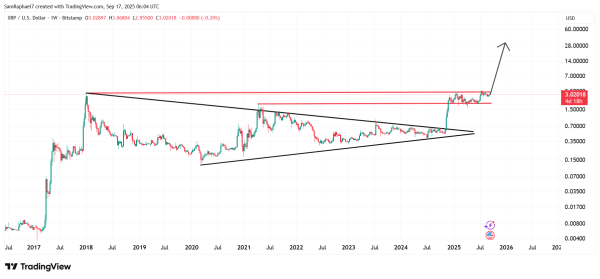
Interestingly, XRP price action since April has remained within the channel. In mid-May, XRP climbed to $2.65 but failed to reach the upper red trendline. From here, it dipped to $1.96 in June, touching the lower red trendline and confirming support.

XRP Maintains Channel Support
However, bulls quickly stepped in, driving the price to a new peak of $3.66 by mid-July for a direct retest of the upper red trendline. Nonetheless, XRP faced a massive rejection. Despite this, XRP has not dropped to retest the lower trendline support. Instead, it continues to consolidate above $3, preparing for another attempt at the ceiling.
Analysts Remain Bullish
Notably, other analysts remain bullish that another leg up could push prices above the channel. For one, Dark Defender recently pointed out that XRP has begun to break through initial weekly resistance.
“The Power of the Waves”
Initial weekly resistance is being broken right now.#XRP targets, $4.39 and the $5.85 Fibonacci levels
Supports: $3.01, $2.85.
As clear as it gets. pic.twitter.com/MjaAqczjSU
— Dark Defender (@DefendDark) September 12, 2025
He presented near-term targets at $4.39 and $5.85 based on Fibonacci levels and highlighted support at $3.01 and $2.85, almost exactly where the lower red trendline from the Sistine Research channel sits.
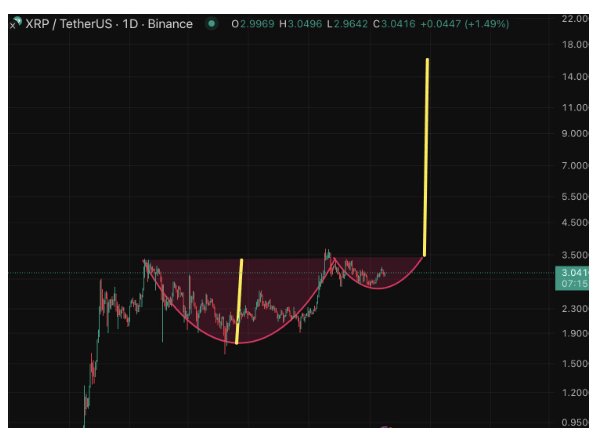
Meanwhile, Baron Dominus highlighted a cup-and-handle formation on the daily chart. The cup formed when XRP dropped from the January peak to $1.61 in April and then recovered to $3.66 in July. XRP is now forming the handle, with potential to reach $15 before year-end if momentum holds.

XRP Cup and Handle Structure | Baron Dominus
Source

 Bitcoin
  Ethereum
  Tether
  XRP
XRP  USDC
USDC  Lido Staked Ether
  TRON
TRON  Dogecoin
  Cardano
  Wrapped stETH
  Figure Heloc
  Wrapped Bitcoin
  Chainlink
  Hyperliquid
  Bitcoin Cash
  USDS
USDS  Wrapped eETH
  Ethena USDe
  Binance Bridged USDT (BNB Smart Chain)
  Stellar
  LEO Token
  WETH
WETH  WhiteBIT Coin
  Sui
Sui  Coinbase Wrapped BTC
  Hedera
  Avalanche
  Zcash
Zcash  Litecoin
  Monero
  Shiba Inu
  Ethena Staked USDe
  Toncoin
  Dai
Dai  USDT0
USDT0  Cronos
  Polkadot
  Mantle
  Bittensor
  MemeCore
  sUSDS
sUSDS  Uniswap
  Aave
Aave  World Liberty Financial
  USD1
USD1  BlackRock USD Institutional Digital Liquidity Fund
  PayPal USD
  Bitget Token
  OKB
OKB  Internet Computer
  NEAR Protocol
  Pepe
Pepe  Ethena
  Ethereum Classic
  Jito Staked SOL
  Binance-Peg WETH
  Falcon USD
  Jupiter Perpetuals Liquidity Provider Token
  Tether Gold
  Wrapped SOL
  Aptos
Aptos  Ondo
Ondo  Pi Network
  Aster
Aster  USDtb
USDtb  POL (ex-MATIC)
  HTX DAO
  Worldcoin
  Dash
Dash  KuCoin
  Rocket Pool ETH
  Binance Staked SOL
  Arbitrum
  Official Trump
  Gate
Gate  Algorand
  Pump.fun
  syrupUSDT
  PAX Gold
  StakeWise Staked ETH
  BFUSD
BFUSD  Kinetiq Staked HYPE
  syrupUSDC
  Lombard Staked BTC
  Function FBTC
  Liquid Staked ETH
  Wrapped BNB
  VeChain
  Cosmos Hub
  Story
Story  Sky
Sky  Binance Bridged USDC (BNB Smart Chain)
  Jupiter
  Renzo Restaked ETH